No More Breakpoints?
I am way past a stage of a crush or merely being in love when it comes to pdb; I’d rather call it a deep love.
Miracurously I have perceived it to be both very flexible and powerful for advanced users as well as very simple and thereby beginner-friendly when catering to rather simple use cases.
What adds to my appreciation for pdb is that - unlike, afaict, most debuggers - it sits rather with the code than the IDE. This agnosticity to IDEs or systems makes it very portable and convenient to use in many different environments, e.g. whenever you only have a terminal access to a machine.
In case you haven’t had the pleasure yet: pdb is a Python debugger. What’s somewhat unusual about it when comparing it to e.g. the PyCharm debugger, the VSCode debugger but also gdb, is that the debugging metadata becomes part of the code. Hence, instead of defining the debug behaviour via funny dots 1 in an IDE or separate references in a debugging tool, we simply modify our code:
import secretmodule

def my_function(argument1, argument2):
	result_1 = secretmodule.sorcery(argument1)
	result_2 = secretmodule.sorcery(argument2)

	# What did the sorcery do?

	breakpoint()

	return result_1, result_2

my_function("hi", "ho")
When executing the above script via $ python pdbexample.py, the execution will halt at the
expected line and enter an interactive Python shell:
$ python pdbexample.py
> /Users/kevinklein/Code/pdbexample.py(11)my_function()
-> return result_1, result_2
(Pdb) type(result_1)
<class 'str'>
(Pdb) len(result_1)
299
(Pdb) print(result_1)
hi
      __             __
   .-'.'     .-.     '.'-.
 .'.((      ( ^ `>     )).'.
/`'- \'._____\ (_____.'/ -'`\
|-''`.'------' '------'.`''-|
|.-'`.'.'.`/ | | \`.'.'.`'-.|
 \ .' . /  | | | |  \ . '. /
  '._. :  _|_| |_|_  : ._.'
     ````` /T"Y"T\ `````
          / | | | \
         `'`'`'`'`'`

(Pdb) print(result_2)
ho
      __             __
   .-'.'     .-.     '.'-.
 .'.((      ( ^ `>     )).'.
/`'- \'._____\ (_____.'/ -'`\
|-''`.'------' '------'.`''-|
|.-'`.'.'.`/ | | \`.'.'.`'-.|
 \ .' . /  | | | |  \ . '. /
  '._. :  _|_| |_|_  : ._.'
     ````` /T"Y"T\ `````
          / | | | \
         `'`'`'`'`'`
Where I first prompted the type of the result of secretmodule.sorcery applied to a string "hi", then investigated its length and followlingly printed it.
Yet, these debugging traces in source code should eventually vanish. And since ‘should’s are only ‘should’s, this will sometimes fail and lead to a nasty CI unit test failure such as this one:
events = [{'colorId': '4', 'created': '2020-01-01T21:34:53.000Z', 'description': '14.91 km', 'end': {'dateTime': '2020-01-01T10...0Z', 'description': '14.91 km', 'end': {'dateTime': '2020-01-06T10:00:00+01:00', 'timeZone': 'Europe/Rome'}, ...}, ...]
sport = <Sport.swimming: 'swimming'>
    @pytest.mark.parametrize("sport", [utils.Sport.swimming, utils.Sport.running])
    def test_prune_events_distance(events, sport):
        filter_function = cal._get_summary_filter(sport)
>       sport_events = list(filter(filter_function, events))
tests/test_cal.py:116:
_ _ _ _ _ _ _ _ _ _ _ _ _ _ _ _ _ _ _ _ _ _ _ _ _ _ _ _ _ _ _ _ _ _ _ _ _ _ _ _
monitoring/cal.py:49: in summary_filter
    if sport == utils.Sport.gym:
/usr/share/miniconda3/envs/monitor/lib/python3.11/bdb.py:90: in trace_dispatch
    return self.dispatch_line(frame)
_ _ _ _ _ _ _ _ _ _ _ _ _ _ _ _ _ _ _ _ _ _ _ _ _ _ _ _ _ _ _ _ _ _ _ _ _ _ _ _
self = <_pytest.debugging.pytestPDB._get_pdb_wrapper_class.<locals>.PytestPdbWrapper object at 0x7f25a459b090>
frame = <frame at 0x7f259d9237c0, file '/home/runner/work/life-monitor/life-monitor/monitoring/cal.py', line 49, code summary_filter>
    def dispatch_line(self, frame):
        """Invoke user function and return trace function for line event.

        If the debugger stops on the current line, invoke
        self.user_line(). Raise BdbQuit if self.quitting is set.
        Return self.trace_dispatch to continue tracing in this scope.
        """
        if self.stop_here(frame) or self.break_here(frame):
            self.user_line(frame)
>           if self.quitting: raise BdbQuit
E           bdb.BdbQuit
/usr/share/miniconda3/envs/monitor/lib/python3.11/bdb.py:115: BdbQuit
In order to prevent this, I built a simple pre-commit hook which, for every git commit, ensures that the code is free of breakpoint() statements.
$ git commit -m "Great work"
black-conda..............................................................Passed
flake8-conda.............................................................Passed
isort-conda..............................................................Passed
no-more-breakpoints-conda................................................Failed
- hook id: no-more-breakpoints-conda
- exit code: 1

ValueError: Found at least one breakpoint in monitoring/cal.py.
You can find information on how to install and use this pre-commit hook here.
Exhibit A:
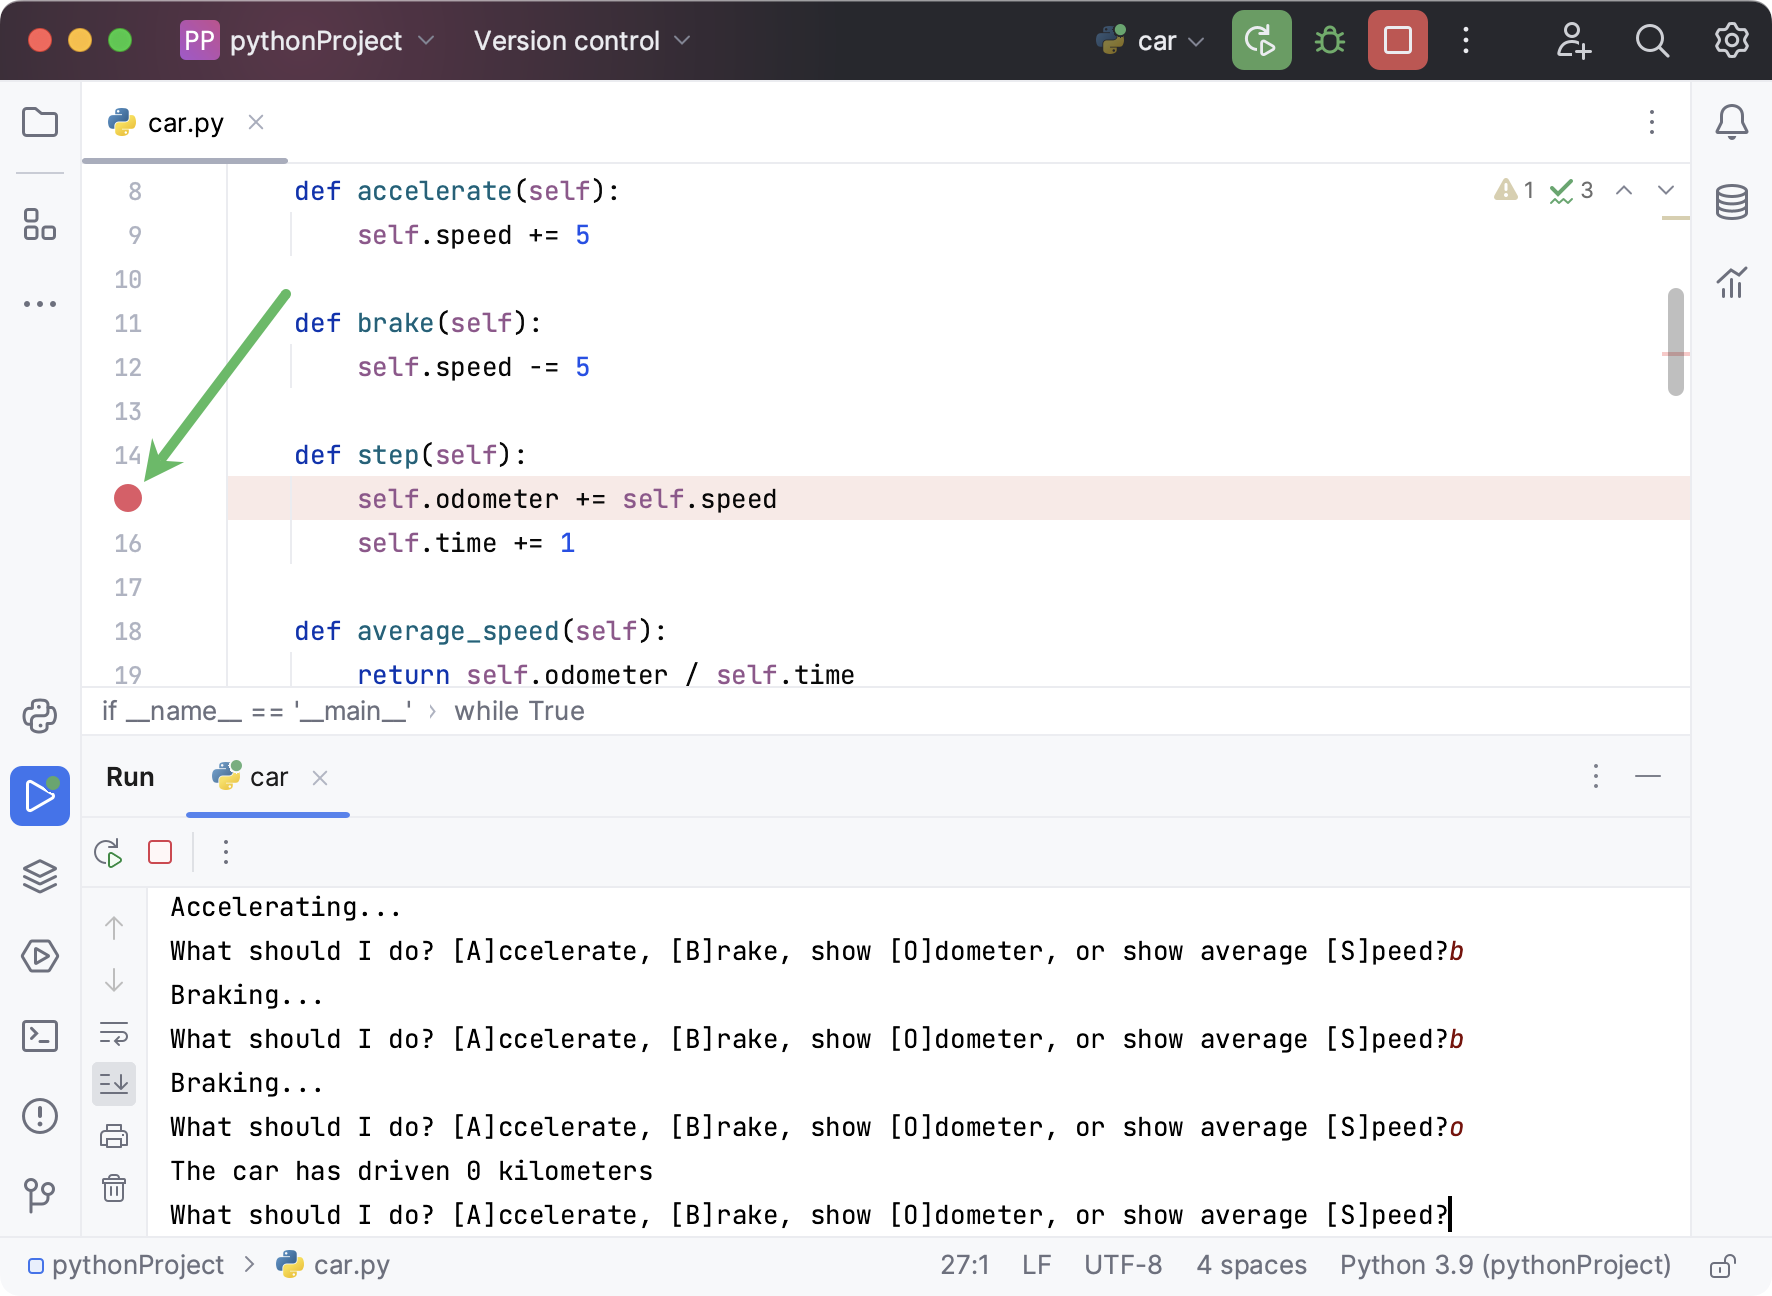 taken from the PyCharm tutorial ↩︎