2021 in Running
As another year is coming to an end I’m curious: What has my running looked like this year? I did something similar in 2020 as well as in 2019.
The gist of it
| 2018 | 2019 | 2020 | 2021 | |
|---|---|---|---|---|
| distance [km] | 430 | 962 | 1295 | 1381 |
| avg distance [km] | 6.61 | 9.08 | 10.53 | 11.05 |
| #runs | 65 | 107 | 123 | 124 |
| #sports activities | 81 | 135 | 210 | 231 |
| share of running among sports activities | 80.25% | 79.26% | 58.57% | 53.68% |
| max duration between 2 runs [days] | 36 | 26 | 18 | 38 |
| #weeks without running | 16 | 5 | 4 | 7 |
After picking up going to the gym in late 2019 and starting to cycle every now and then in 2020, I made the tail end of activities a little longer by hiking, playing tennis, bouldering and swimming just a couple of times - hence the lower share of running.
The stark increase in the maximal duration between two runs seems to be the consequence of an injury-ridden spring.
A bit more than the gist of it
The top-left plot, comprising all runs of 2021 and their respective distances, also indicates the injury with a gaping hole roughly between April and June. Also, it shows both of my attempts to run above-marathon distance.
The top-right plot still shows some mass of runs between 10am and 4pm, yet I seem to have shifted more runs into morning and evening than before.
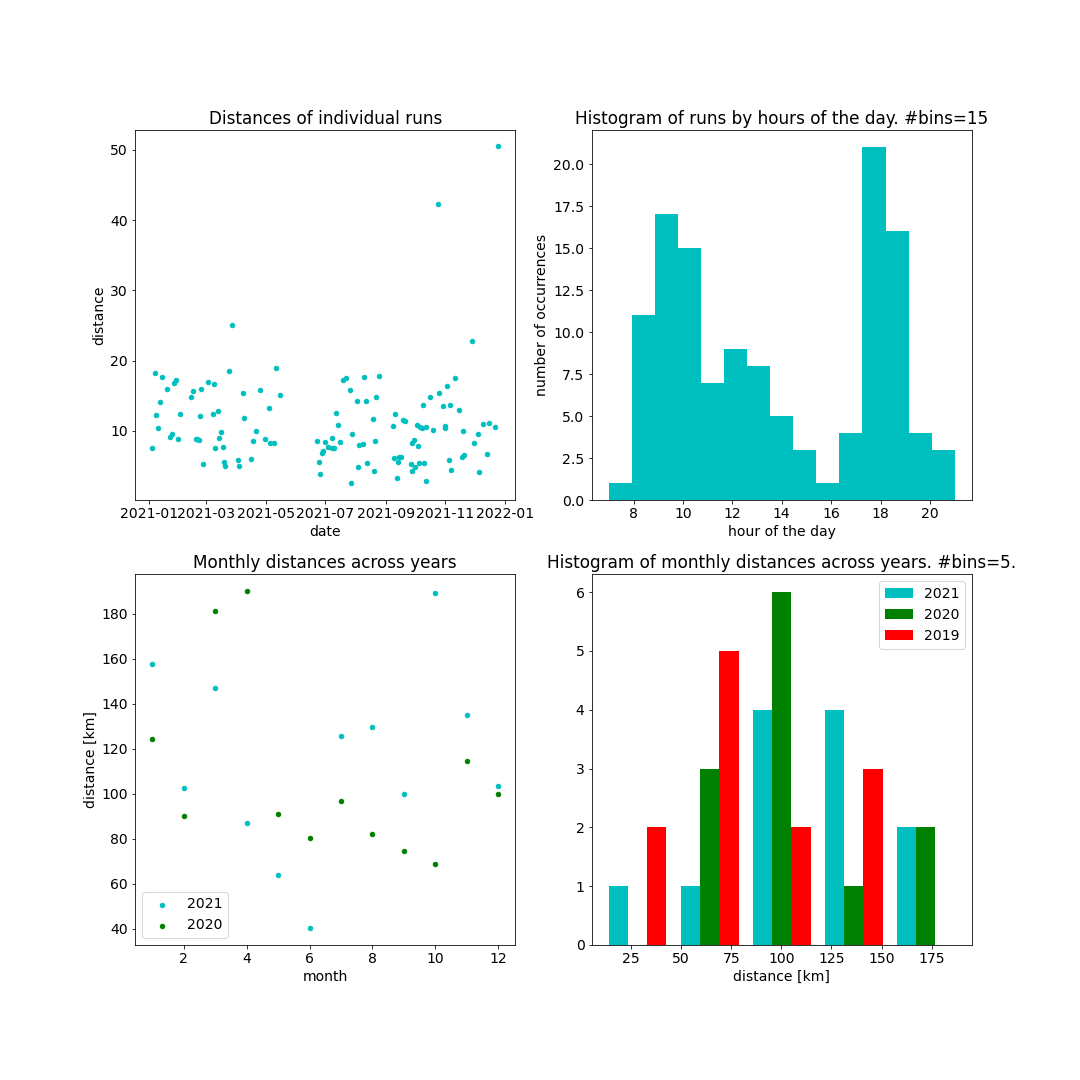
I figure one could try to read the impact of pollen into the bottom-left plot - since even in 2020 my running tanked enormously in May. At the same time, my dim memory tells me that I had some light but non-negligible injury in the summer of 2020 as well. Independently of the cause(s), I seem to have fared better in regaining momentum in the second half of 2021 than in 2020.
Overall, it seems like my running might have become a bit more consistent at the monthly aggregation level. This is also indicated by the bottom-right histogram of monthly distances across years.
Talking about consistency: Have I been able to accumulate much volume along the span of two weeks?
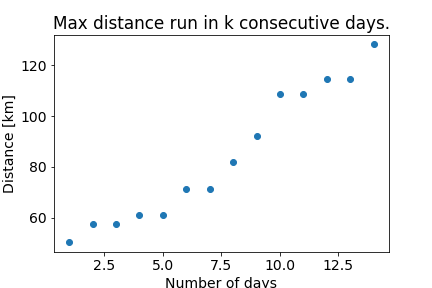
Sort of?
Heart rate
While previously an avid refuser of any running gear of non-trivial sophistication, I let my injury and the physiotherapist convince me to purchase a watch monitoring my heart rate. The purpose not merely being observation but rather intervention, I was instructed to start running in ‘zone 1’ or ‘zone 2’.
Quickly did I figure out that this is far from what I’d been used to. My standard feel-good running pace had usually been below 5’/km. It turned out that this would usually bring me either to the devilish zone 3 or the to-be-savoured-in-small-quantities zone 4. :S:S:S
As a consequence, I had to reduce my running pace by roughly 50%. This was pretty challenging and took me a long time to get accustomed to.
Given this, I’m pleasantly surprised that my yearly running volume didn’t drop too much - neither due to no longer being able to afford the time to run similar distances at a substantially slower pace nor due to it breaking my morale.
Anyhow - some people claim that running in aforementioned zone 2 will diminish heart rates for a given pace in any zone and thereby implicitly ‘make you faster’. Hopeful that my sacrifice in speed would also be of some benefit other than preventing injury - what’s the worth of that after all - I wondered:
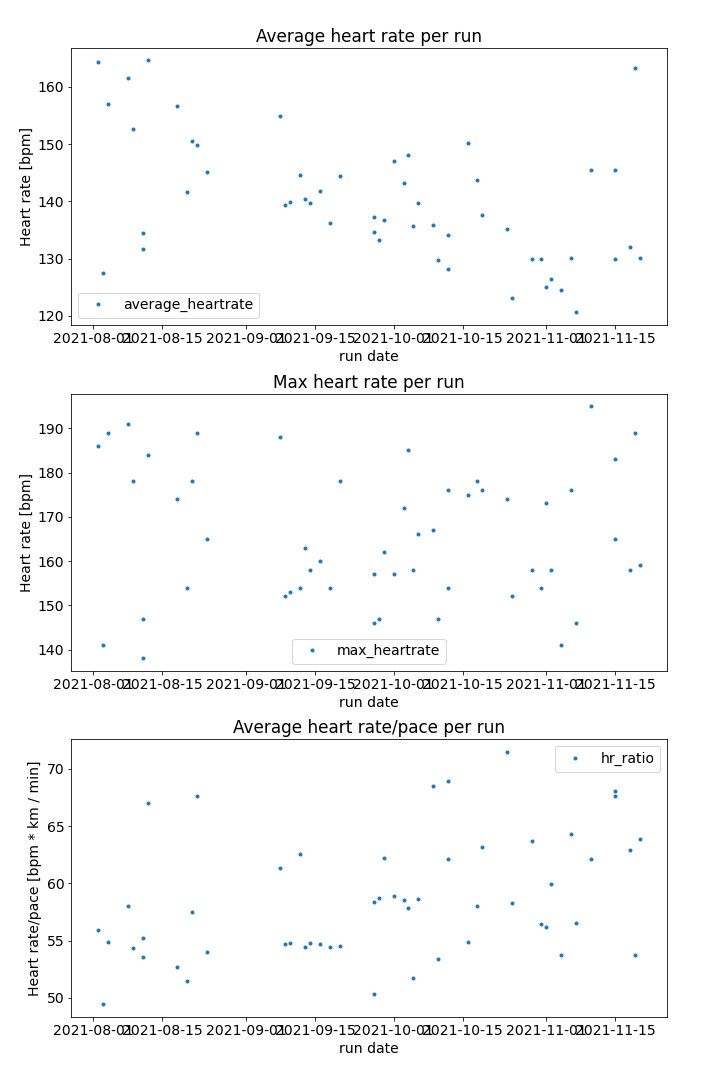
Has my heart rate gotten lower for a fixed pace?
The above question is extremely hard to answer truthfully since the data is neither constant nor independently random across all other dimensions - sleep, weather, distance, elevation, prior exhaustion and motivation to only name a few. I figured, it could still be that averaging across months, a useful trend could prevail.
I have resorted to using the Strava API to tackle a proxy for that question. Strava, a second source of running data of mine, connects to my watch and stores both heart rate and pace data.
“Something, something negatives results”, right?
Code for the analyses based on my calendar data can be found here. Code for the heart rate analysis based on the Strava API can be found here.