2020 in Running
Yet another year’s almost over. Let’s have a look at my year 2020 in running, just as I did in 2019.
Yearly comparison
| 2018 | 2019 | 2020 | |
|---|---|---|---|
| distance [km] | 430 | 962 | 1295 |
| avg distance [km] | 6.61 | 9.08 | 10.53 |
| number of runs | 65 | 107 | 123 |
| share of running among sport activities | 80.25% | 79.26% | 58.57% |
I picked up going to the gym in late 2019 and started cycling every now and then in 2020, hence the lower share of running. I’m desperately curious about the counterfactual of how my running would have turned out if not for the other activities.
Individual runs
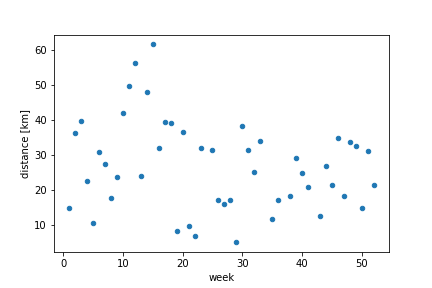
First, let’s get a feel for what we are talking about by looking into all runs throughout the year:
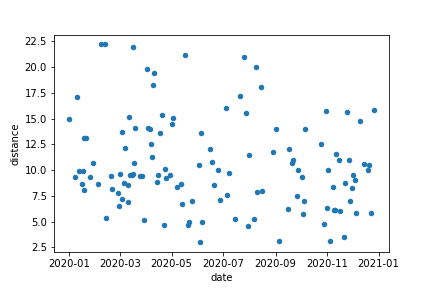
It becomes apparent that the spread in distances is fairly wide and that there is no glaring training effect, indicated by a growing average with high concentration. Also, we can observe that I stopped going for ’longer’, i.e. >16 km runs in August.
Why are there super short-distance runs, <5 km?
While I’m no longer sure, I think those were partly interruptions due to injuries and partly treadmill warm-ups at the gym.
In terms of the temporal distribution of runs, nothing obvious strikes me. This raises the question (that is, at least in my head):
What was the longest duration between two runs?
In October, there was a sequence of 19 days without running. I’m totally okay with this and it doesn’t bother me at all that I hadn’t been running for more than two and a half weeks.
Shifting the focus back to good news, let’s look into the longest runs.
What were the top 10 distances?
| rank | distance [km] |
|---|---|
| 1 | 22.20 |
| 2 | 22.20 |
| 3 | 22.00 |
| 4 | 21.19 |
| 5 | 21.00 |
| 6 | 20.00 |
| 7 | 19.78 |
| 8 | 19.42 |
| 9 | 18.25 |
| 10 | 18.02 |
Considering that only before 2019, my second-longest run ever had been 12.97 km, this is a significant change even though it didn’t feel like one. Nice.
We also just learned that the longest run or maximum distance has been 22.20 km. Generalizing the question, we might want to ask:
What was the maximum distance run in k consecutive days? [0]
| number of days | distance [km] | number of days | distance [km] |
|---|---|---|---|
| 1 | 22.2 | 9, 10, 11, 12 | 109.34 |
| 2 | 37.67 | 13 | 118.17 |
| 3 | 48.97 | 14, 15 | 127.68 |
| 4 | 61.5 | 16 | 141.32 |
| 5 | 65.88 | 17, 18 | 147.86 |
| 6 | 75.5 | 19 | 157.43 |
| 7 | 76.53 | 20 | 163.93 |
| 8 | 90.6 | 21 | 171.66 |
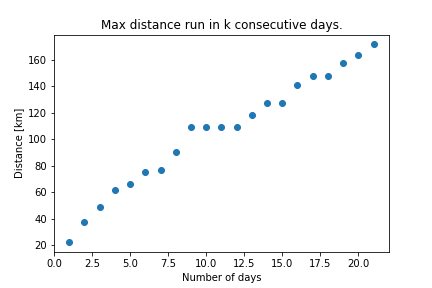
I was surprised to see a somewhat linear-looking shape. I expected a greater tendency to sub-linear growth, as I tend to have bursts of running - at times running what feels like a lot in a few days - followed by perceived slacking off.
One thing must not go missing in a qualitative, mostly visual, somewhat superficial, small-n analysis: a histogram.
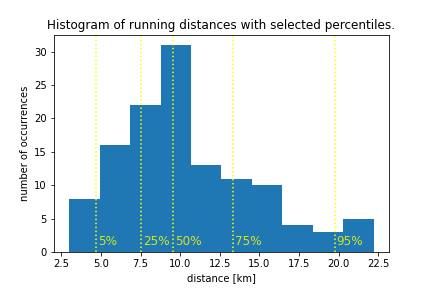
Considering the wide spread both observed in the histogram as well as the plot of of individual runs, I’m wondering
Are there ‘classes’ of runs, depending on the time of the day?
So let’s look into empirical distributions of distances by hour of the day. I used the start time of a run.
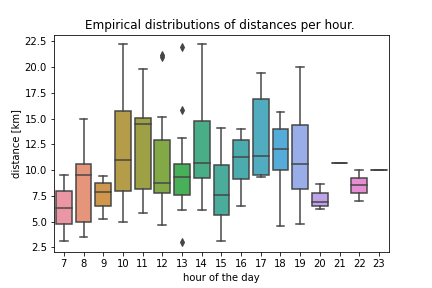
Well, not evidently, no. Talking about hours of the days:
When did I go for runs?
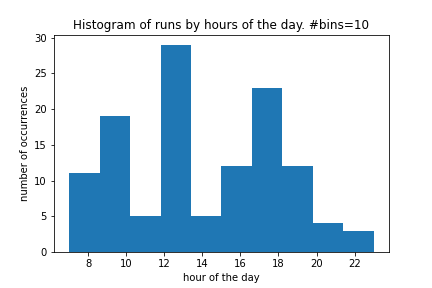
Looks like I’m just an average Joe, really.
Weekly running
Extending the granularity of our data points a little, these are the running distances per week:
Just as with the individual runs, we observe a large variance of distances covered.
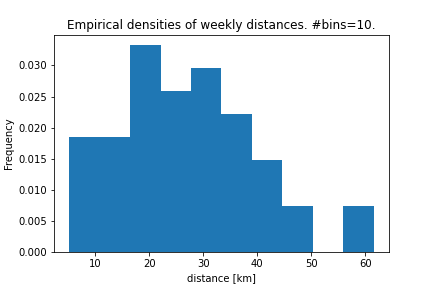
The same picture is painted by the histogram/empirical densities. Will this variation even out if aggregating over months?
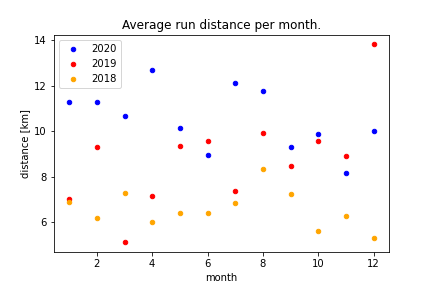
Monthly running
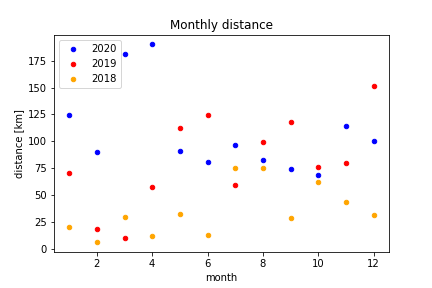
Yes indeed. While the previous year still came with greater spread in cumulative distance across months, 2020 looks pretty stable around ~90 km. Looking at the average run distance across months we also observe greater concentration around the mean:
What we’ve noted very qualitatively can also be seen more quantitatively: the empirical densities indicate a higher peak in 2020:
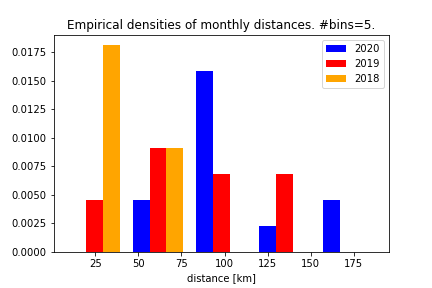
So we observe a peak for 2018, at lower distance and a peak for 2020 at a greater distance. 2019 being more widespread could allow for the post-hoc rationalization of 2019 being a ’transitory year’ similar to the somewhat homogeneous 2018 at first but then setting the trend of the similarly homogeneous 2020.
Many thanks to Lorenz for suggestions.
[0] Oh yes! This actual is a ‘real life’ application of a max sum sliding window problem, we, programmers, have been waiting for.