2019 in Running
As explained in a previous post, I log the distances of my runs. In the following I will make some simple observations based on this data. The data goes back to 2016 and comprises timestamps and running distances in km.
In bad storytelling manner let’s start with the most graspable and interesting statistic first: average and overall distance across years. I had never computed those before and had basically no intuition on it at all. I couldn’t have said whether I had been running more or less than last year. Turns out there was a substantial difference.
| 2016 | 2017 | 2018 | 2019 | |
|---|---|---|---|---|
| avg distance | 4.79 | 5.62 | 5.61 | 9.08 |
| distance | 134 | 354 | 430 | 962 |
Given this lack of intuition I find it rather surprising to see the yearly distance increase more than twofold. I guess I won’t complain. :) The increased average distance made me wonder: Did I only leave out shorter runs or did I actually run ’longer runs’? As an, arguably weak, proxy I looked into the 20 longest runs I had every run and investigated which year they belonged to. Turns out practically all of them stem from 2019.
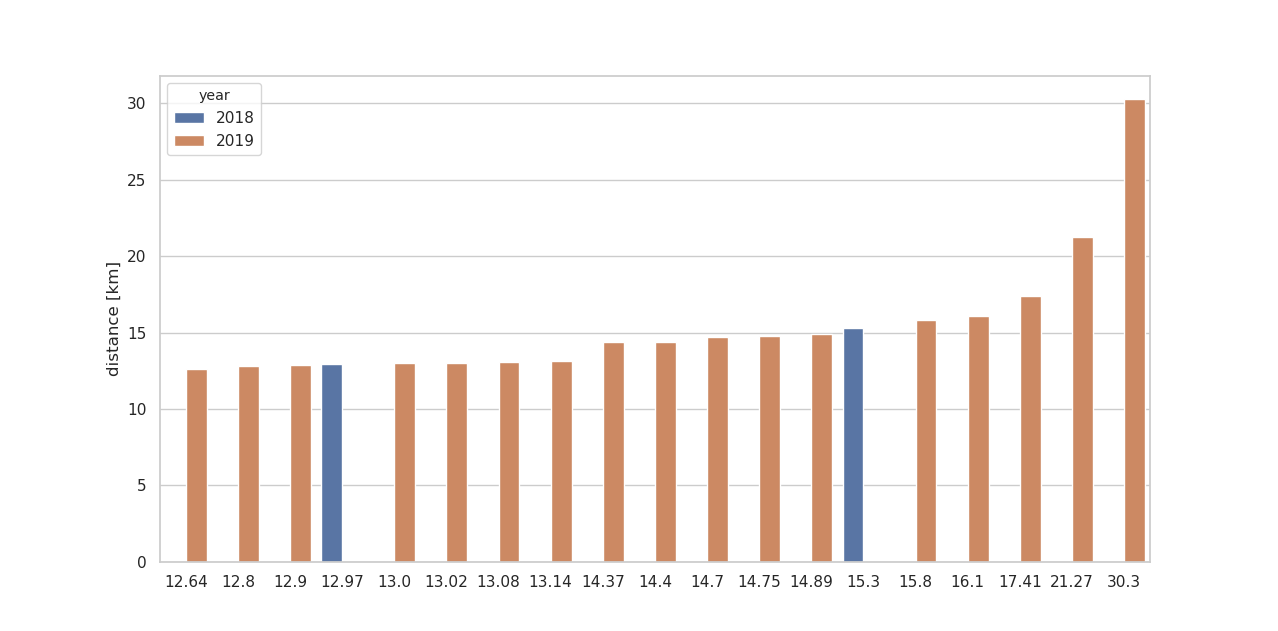
I figure this expresses that the average distance did not only increase through leaving out shorter runs.
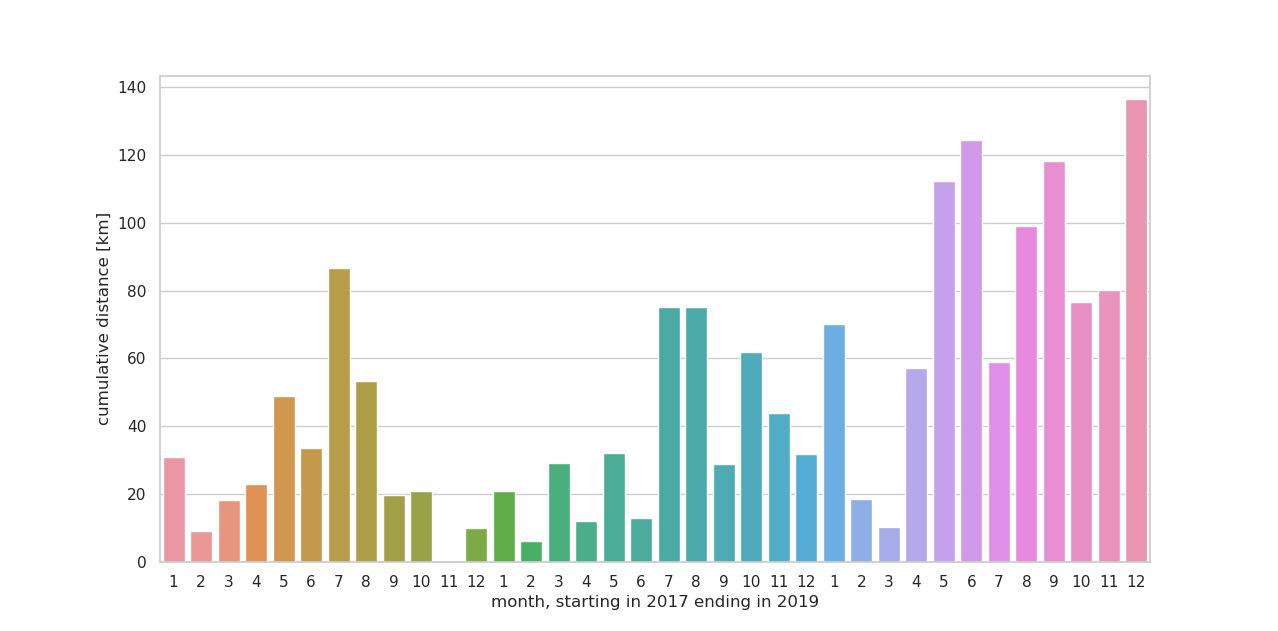
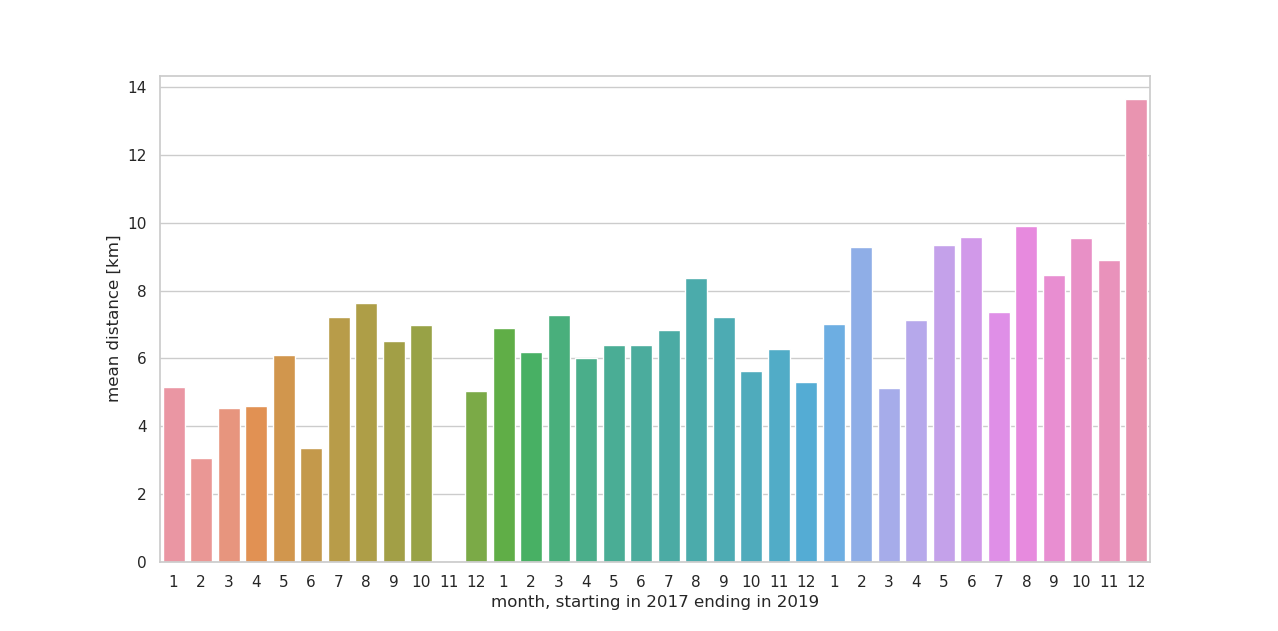
Moreover, I wondered whether there were periodic phenomena on a monthly scale. Despite usually considering myself more or less indifferent to weather conditions, the following plot shows peaks in the summer months for 2017 and 2018. 2019 paints a less clear picture. Maybe the summer peaks and the summer are not causally related but only correlated by say a change of lifestyle? Both summers of 2017 and 2018 did not have me attend and work for lectures but rather intern and do exam prep.
Overall, the average run distance does not seem to be vastly influenced by seasonal/periodic circumstances. I tell myself that this vaguely and qualitatively confirms my wishful thinking of me not being a fair weather runner. :)
Within 2019, I looked into weekly stats. It turns out that I averaged at 2.04 runs per week and 18.5 km per week. Following are histograms of the number of weekly runs and weekly distances with said means as vertical lines.
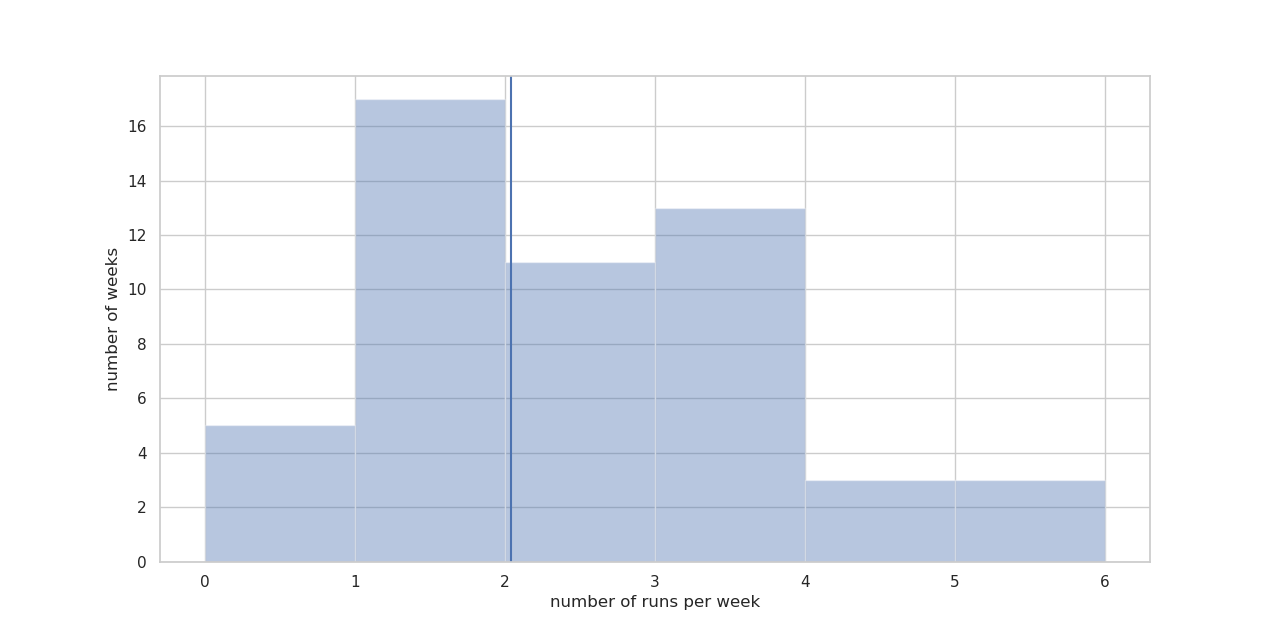
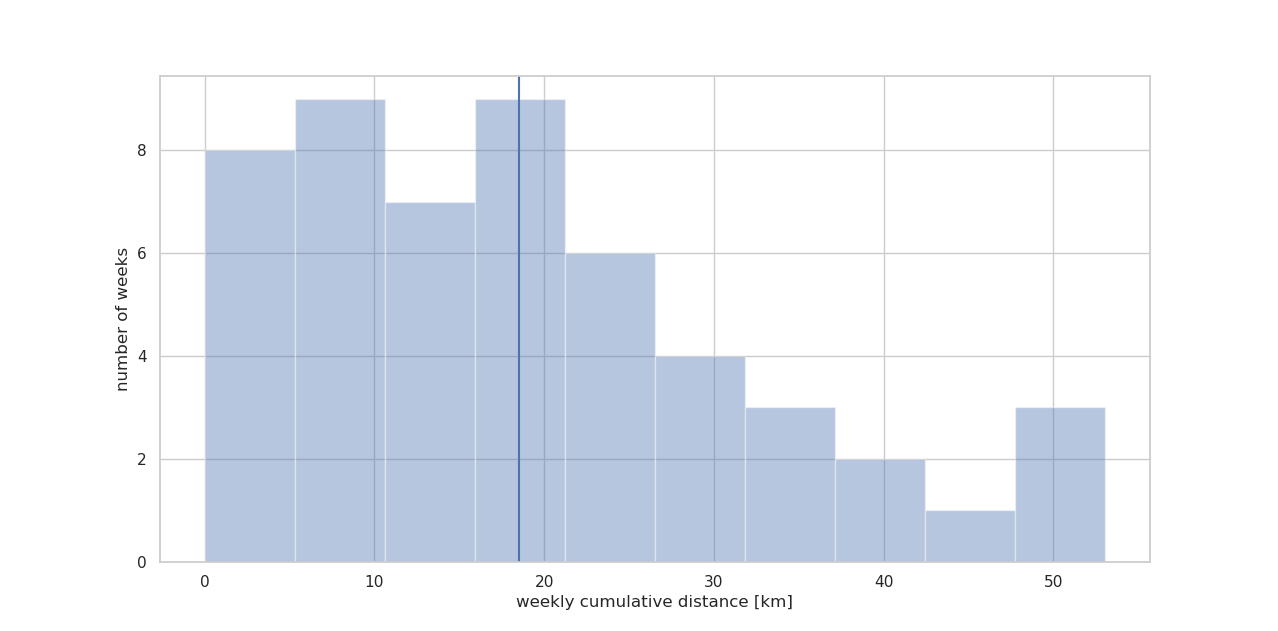
While quite a few weeks came with fairly little mileage, I’m quite satisfied to see that there were only 5 weeks without running despite quite several of traveling.
Lastly, I wondered: Are greater weekly distances more associated with how often I pulled myself together to go for a run or more associated by for how long I hung in runs? For that purpose, restricting myself to linear effects, I computed the Pearson coefficients between said metrics.
| Pearson coefficient | ||
|---|---|---|
| weekly distance | weekly average distance | .65 |
| weekly distance | weekly number of runs | .88 |
While there is no simple answer to the brought-up question, this might be an interesting observation that is vaguely related.