Running Log
Problem
Sports tracking apps offer lots of interesting functionalities regarding the logging of activities. I figured most of what they provided was only interesting in short-term for two reasons.
On the one hand, I changed phones and tracking apps from time to time, which would sometimes lead to a reset of information. Also, some tracking apps were discontinued. You could say they introduced technical debt that I often was not willing or able to carry on.
On the other hand, the kind of information they provided was only relevant in the short term. I would care about pace comparisons on the same track within the scope of a month, about calories in the scope of a day or week, but not months and years.
I am aware that this is an arbitrary situation that might be very different for other people.
I was looking for a long-term logging of information that seemed relevant in the long-term: Frequencies of exercise and running distances.
Requirements
- Data stored in a central place.
- That place very likely to persist over the course years.
- Able to express information about when I exercised, and what distance I ran if said exercise was running.
- Convenient to read and write information on both mobile and browser.
- Able to portray developments over time.
Solution
Google Calendar offered many advantages that fit the situation:
- I was already using it for other timetelling purposes.
- I had reason to assume it was not going away any time soon.
- Mature and convenient interfaces: API, mobile app, web app.
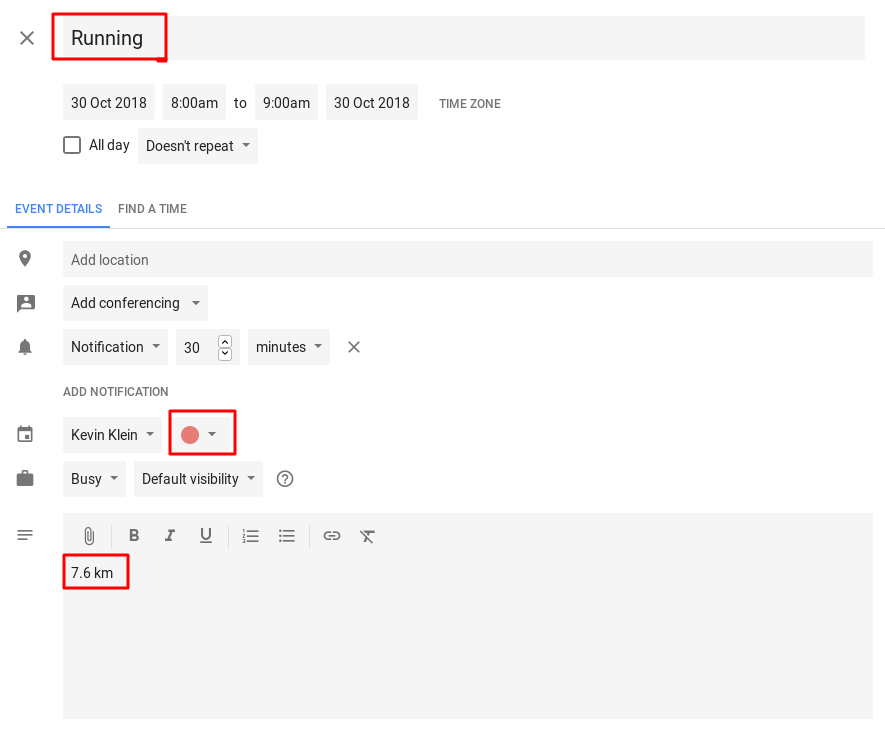
Hence I decided to log all sports activities in my private calendar with a specific color code. Also, I named the entries accordingly, e.g. ‘Running’. Information about distances was taken care of by populating the event description with an indication, e.g. ‘9.6 km’.
I wrote a simple script to query the calendar events from Google’s API and opted to visualize the data by aggregating per week distances and plotting weeks against distances within a certain time interval.
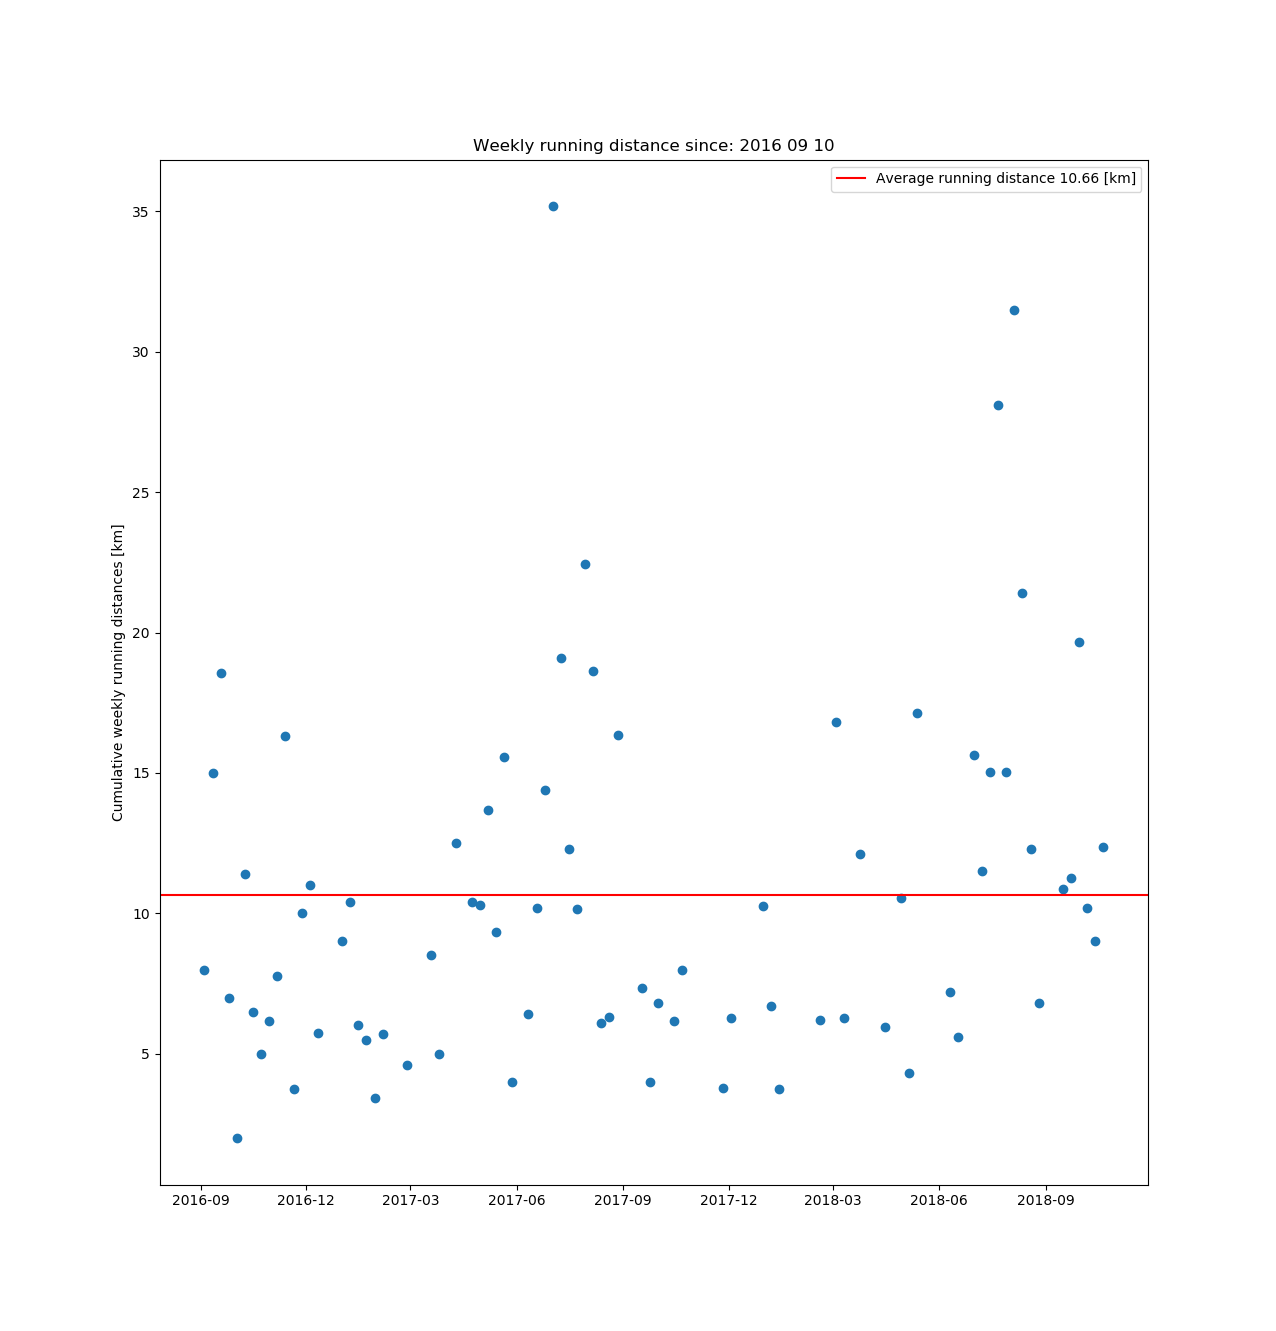
There still is a lot of room for more elaborate analysis both in terms of metrics and visualizations.
Comments
- Note that using this manual logging approach served as a substitution to logging apps for me, but can very well be considered complementary to them.
- I’ve been using this script for quite a while and I find it quite interesting to look into trends of my activities. I have been logging events accordingly for 2-3 years.
- It was fun to use data about myself myself and I’d encourage you to play around with the calendar API as well, given that you have some kind of consistency in logging events.
You can find the code here, it is supposed to be easy to execute and understand.
Update 19/08/19: Interactive d3 visualization in browser
After some years of telling myself to work with d3 again, I finally used this little project to do so. I used the exact same data and fed them to an interactive visualization. More concretely, running distances, both on a daily and weekly basis, are plotted against dates. The advantages of the interactive visualizations are:
- Tooltip indicating exact distance when hovering over individual datapoint.
- X-axis (dates) is zoomable by scrolling anywhere over the visualization.
- X-axis (dates) is pannable once zoomed in.
You can easily give the live demo a try, courtesy of my data. ;)
The repository now contains both approaches.